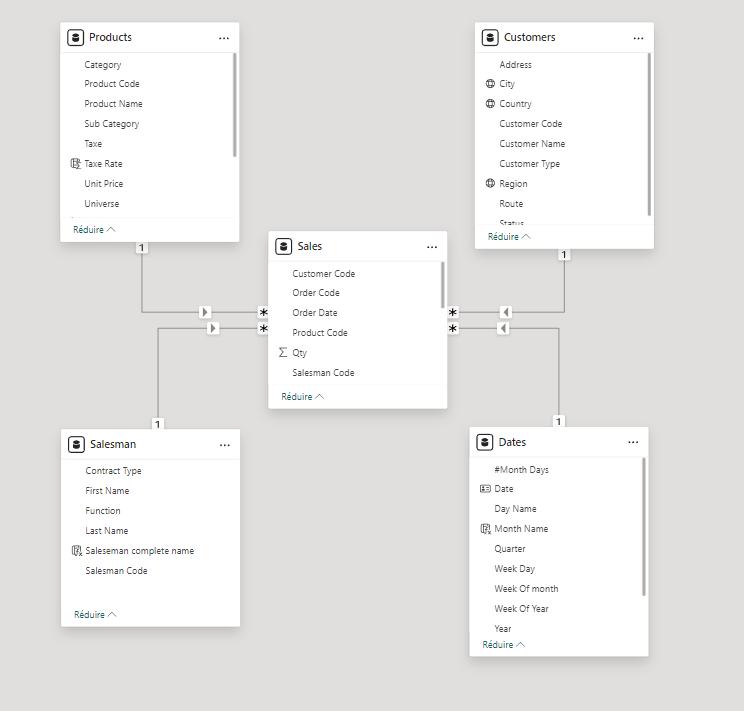
Imagine you have a massive puzzle made of numbers, customer names, sales figures, and product codes. It’s a treasure trove of information, but it can feel overwhelming. That’s where a special organizing system comes in, something called a Star Schema. It’s like creating a clear map that helps us quickly find the insights we need from all that data.
Why Organize Our Data?
Think about the way your office is organized. You don’t just dump all your papers in a big pile. You likely have files, folders, and maybe even a filing system. That’s because organization helps you quickly find what you’re looking for. Similarly, in Business Intelligence (BI), we need to organize our data to quickly and easily analyze it and understand it.
What is the Star Schema?
The Star Schema is a common way of organizing data for analysis in BI systems. Picture a star – that’s what it looks like when you draw it out! At the center of the star is what we call a Fact Table, and surrounding it are Dimension Tables, like the points of a star.

The Heart of the Star: The Fact Table
The Fact Table is the core of the whole model. It holds the main events or transactions you want to analyze. Think of it like the central record of what happened. Examples of a Fact Table might include:
- Sales: Contains information like the date of a sale, the quantity sold, the total amount, and product details.
- Website Visits: Stores data about how many people visited your website, which pages they looked at, and how long they stayed.
- Inventory: Includes information about the quantity of each product you have in stock.
Key things about Fact Tables:
- They primarily contain numbers (numerical values) that we can measure and analyze (like sales amount, quantity, or number of clicks).
- They’re usually very large, containing many rows of records.
- They’re linked to the Dimension Tables using unique IDs.
The Points of the Star: Dimension Tables
The Dimension Tables hold the descriptive information that adds context to the data in the Fact Table. They’re like the “who, what, where, when, and how” of your data. Here are some examples of Dimension Tables:
- Customer: Contains customer information, like name, address, city, and other details.
- Product: Holds details about your products, such as their names, descriptions, categories, and cost.
- Time/Date: Includes data about specific days, weeks, months, and years.
- Location: Stores data about your store locations or geographic regions.
Key things about Dimension Tables:
- They contain descriptive text (like names, descriptions, and locations).
- They are usually smaller compared to the fact table.
- They “describe” the data in the Fact Table.
How the Star Schema Helps
Think of the Fact Table as the action or event, and the Dimension Tables as the background information that tells you more about it. By linking them together, you can easily answer important questions like:
- “What were our total sales of product X in February in New York?” (Combining the Sales Fact Table with Product, Date, and Location Dimensions).
- “Which of our customers purchased the most products last month?” (Combining the Sales Fact Table with the Customer and Time Dimensions).
- “Which website pages have the most visits from users in Europe?” (Combining the Website Visits Fact Table with the Location and Website page dimensions).
Benefits for You
For you as a Business User, the Star Schema helps by:
- Making data easier to understand: You can easily analyze the data from your business in a way that makes sense.
- Enabling faster reporting: The organized structure allows reporting tools to access information quickly, getting you the answers you need without delay.
- Providing a clearer picture of your business: With all the relevant data organized and connected, you can see trends, patterns, and insights you might otherwise miss.
- Improving decision-making: By quickly answering your business questions, you can make better decisions, faster.
In Summary
The Star Schema is a powerful yet simple tool to structure your data for BI. It connects your key business actions (facts) with important contextual details (dimensions). This makes your data more accessible, easier to understand, and empowers you to gain the insights you need to run your business effectively. So, the next time you see data presented in a Star Schema, you’ll know it’s there to make your job easier and help you unlock the full potential of your data.


