

Government and Administration Standard Dashboards and KPIs
December 28, 2024
Why Spreadsheets Are Holding Your Business Back (and How to Break Free)
December 29, 2024- 1. Understanding the Value of BI in E-Commerce
- 2. Key Areas Where BI Drives E-Commerce Growth
- a) Customer Insights and Personalization
- b) Inventory and Supply Chain Management
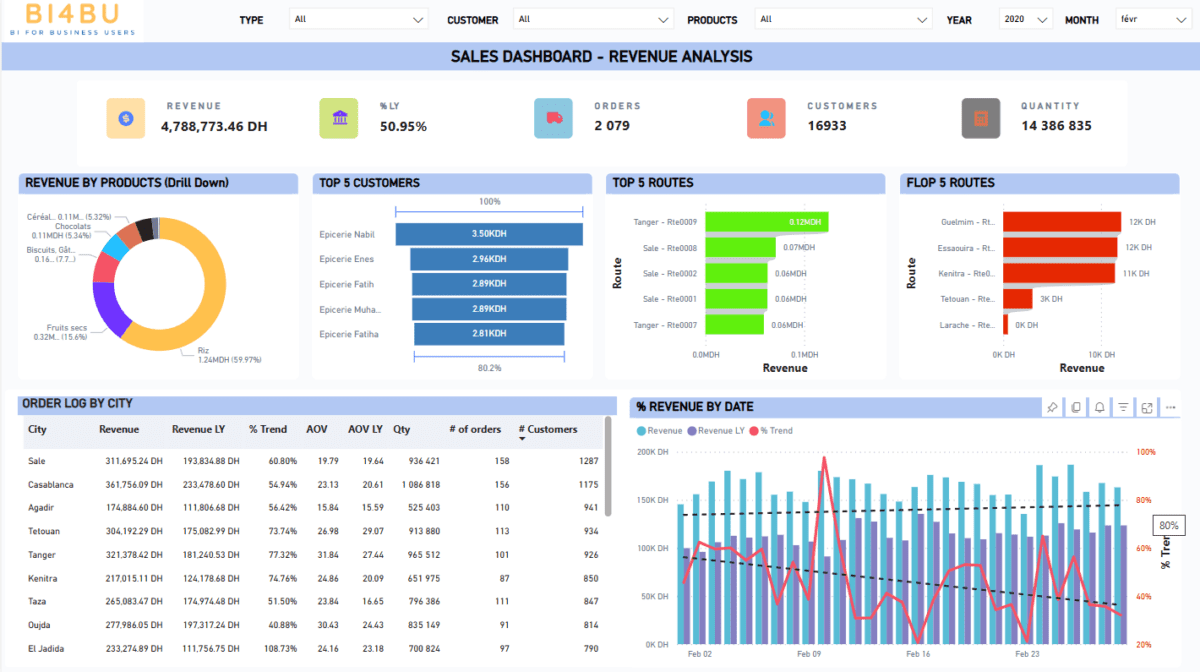
- c) Sales and Revenue Analysis
- d) Marketing Campaign Optimization
- e) Customer Retention and Churn Reduction
- a) Customer Insights and Personalization
- b) Inventory and Supply Chain Management
- c) Sales and Revenue Analysis
- d) Marketing Campaign Optimization
- e) Customer Retention and Churn Reduction
- 3. BI Tools and Technologies for E-Commerce
- 4. Challenges in Implementing BI for E-Commerce
- 5. Best Practices for Using BI in E-Commerce
- 6. Real-Life Examples of BI Driving E-Commerce Success
- Conclusion
In today’s fast-paced digital economy, e-commerce businesses face intense competition and an ever-changing landscape. To stay ahead, companies must harness the power of data to make informed decisions. Business Intelligence (BI) plays a pivotal role in driving e-commerce growth by transforming raw data into actionable insights, enabling businesses to optimize their strategies and achieve sustainable growth.
1. Understanding the Value of BI in E-Commerce
Business Intelligence refers to the tools, technologies, and processes used to collect, analyze, and present business data. For e-commerce businesses, BI is crucial in:
- Enhancing decision-making: By analyzing sales trends, customer behaviors, and operational efficiency.
- Identifying opportunities: Spotting emerging markets or product categories based on historical data and predictive analytics.
- Improving customer experiences: Offering personalized recommendations and streamlining user journeys.
- Monitoring operational efficiency: Ensuring seamless backend processes such as inventory and logistics.
2. Key Areas Where BI Drives E-Commerce Growth
a) Customer Insights and Personalization
- KPIs:
- Customer Lifetime Value (CLV):
- Formula: CLV = (Average Purchase Value) × (Purchase Frequency) × (Customer Lifespan).
- Example: If a customer spends $50 per purchase, makes 10 purchases annually, and stays for 5 years: CLV = 50 × 10 × 5 = $2500.
- Cart Abandonment Rate:
- Formula: Cart Abandonment Rate = (1 – (Completed Transactions / Shopping Carts Created)) × 100.
- Example: If 100 carts are created, but only 30 are completed: Cart Abandonment Rate = (1 – (30 / 100)) × 100 = 70%.
- Personalization Success Rate:
- Formula: Personalization Success Rate = (Purchases from Personalized Recommendations / Total Purchases) × 100.
- Customer Lifetime Value (CLV):
b) Inventory and Supply Chain Management
- KPIs:
- Inventory Turnover:
- Formula: Inventory Turnover = Cost of Goods Sold (COGS) / Average Inventory Value.
- Example: If your COGS is $1,000,000 and the average inventory is $200,000: Inventory Turnover = 1,000,000 / 200,000 = 5.
- Stockout Rate:
- Formula: Stockout Rate = (Number of Stockouts / Total Product Requests) × 100.
- Example: If 20 products were out of stock out of 200 requests: Stockout Rate = (20 / 200) × 100 = 10%.
- Supplier Lead Time:
- Formula: Lead Time = Average Time from Order Placement to Delivery.
- Inventory Turnover:
c) Sales and Revenue Analysis
- KPIs:
- Conversion Rate:
- Formula: Conversion Rate = (Total Sales / Total Visitors) × 100.
- Example: If 5,000 visitors led to 500 purchases: Conversion Rate = (500 / 5000) × 100 = 10%.
- Average Order Value (AOV):
- Formula: AOV = Total Revenue / Number of Orders.
- Example: If your total revenue is $100,000 from 2,000 orders: AOV = 100,000 / 2,000 = $50.
- Gross Profit Margin:
- Formula: Gross Profit Margin = ((Revenue – COGS) / Revenue) × 100.
- Conversion Rate:
d) Marketing Campaign Optimization
- KPIs:
- Return on Ad Spend (ROAS):
- Formula: ROAS = Revenue from Ads / Ad Spend.
- Example: If $5,000 in ad spend generated $20,000 in revenue: ROAS = 20,000 / 5,000 = 4.
- Cost Per Acquisition (CPA):
- Formula: CPA = Total Marketing Costs / Number of New Customers Acquired.
- Click-Through Rate (CTR):
- Formula: CTR = (Total Clicks / Total Impressions) × 100.
- Return on Ad Spend (ROAS):
e) Customer Retention and Churn Reduction
- KPIs:
- Customer Retention Rate (CRR):
- Formula: CRR = ((Customers at End of Period – New Customers Acquired) / Customers at Start of Period) × 100.
- Churn Rate:
- Formula: Churn Rate = (Customers Lost / Total Customers at Start) × 100.
- Net Promoter Score (NPS):
- Formula: NPS = % Promoters – % Detractors.
- Use customer surveys to calculate this.
- Customer Retention Rate (CRR):
a) Customer Insights and Personalization
- Behavioral Analysis: BI tools analyze customer behavior, preferences, and purchase history to:
- Create personalized marketing campaigns tailored to individual needs.
- Recommend products using collaborative filtering or AI-driven methods.
- Identify high-value customer segments to focus retention strategies.
- Customer Lifetime Value (CLV): Measure and predict the profitability of customer segments to allocate marketing budgets effectively.
b) Inventory and Supply Chain Management
- Demand Forecasting: Leverage historical sales data and predictive analytics to:
- Anticipate future product demand and avoid overstock or stockouts.
- Optimize warehouse storage and inventory levels for cost efficiency.
- Supplier Performance Monitoring: Use BI dashboards to track key supply chain metrics such as:
- Delivery lead times.
- Supplier quality performance.
- Logistics cost analysis.
c) Sales and Revenue Analysis
- Sales Performance Tracking: Monitor sales trends by:
- Product category.
- Geography (city, region, or country).
- Time periods (daily, weekly, seasonal).
- Profitability Analysis: Use advanced BI tools to calculate profit margins for products, ensuring alignment with pricing strategies.
- Upselling and Cross-Selling Opportunities: BI tools identify correlations in customer purchases to:
- Recommend complementary products.
- Suggest premium options to increase basket size.
d) Marketing Campaign Optimization
- Channel Analysis: Track marketing ROI across platforms such as:
- Social media (Facebook, Instagram).
- Email campaigns.
- Paid advertising (Google Ads, PPC).
- A/B Testing: Use BI tools to evaluate the effectiveness of different campaign elements, such as subject lines or ad creatives.
- Real-Time Campaign Adjustments: Adjust targeting or budgets dynamically based on performance data.
e) Customer Retention and Churn Reduction
- Retention Metrics: Track and reduce churn by analyzing post-purchase data.
- Identify patterns in customers likely to leave.
- Offer incentives such as discounts or loyalty rewards to retain high-value customers.
- Feedback Analysis: Use sentiment analysis from customer reviews and surveys to improve products and services.
3. BI Tools and Technologies for E-Commerce
Popular Tools for E-Commerce BI:
- Google Analytics:
- Provides insights into website traffic, user behavior, and conversion rates.
- Tracks customer journeys to identify bottlenecks.
- Power BI and Tableau:
- Advanced visualization and interactive dashboard capabilities.
- Allows deep dives into multi-dimensional data.
- Shopify Analytics:
- Built-in analytics for Shopify users to monitor store performance and track KPIs.
- BigQuery and Snowflake:
- Data warehousing solutions for large-scale analytics.
- Enable quick querying of massive datasets.
- AI-Powered Tools (e.g., Salesforce Einstein Analytics):
- Leverages AI for predictive analytics and customer segmentation.
Integrations with E-Commerce Platforms:
- Integrate BI tools with systems like Magento, WooCommerce, and Shopify for seamless data flow.
- Automate data pipelines using tools like Zapier or custom APIs.
4. Challenges in Implementing BI for E-Commerce
While BI is a game-changer, its implementation comes with challenges:
- Data Integration: Combining data from multiple sources (CRM, ERP, website analytics) can be complex.
- Data Quality Issues: Ensuring accurate, consistent, and clean data is critical.
- High Initial Costs: BI tools and infrastructure investments can be expensive, particularly for smaller businesses.
- Training and Adoption: Teams need adequate training to interpret and act on BI insights effectively.
- Scalability: Ensuring BI systems can handle growing data volumes as businesses scale.
5. Best Practices for Using BI in E-Commerce
- Define Clear Objectives:
- Align BI initiatives with specific business goals, such as improving conversion rates or enhancing customer retention.
- Invest in Scalable Infrastructure:
- Choose tools that can grow with your business, ensuring long-term viability.
- Ensure Data Quality:
- Implement regular data validation and cleansing processes.
- Create Role-Based Dashboards:
- Tailor dashboards to different user roles (e.g., executives, marketing managers) for focused insights.
- Monitor KPIs Continuously:
- Use real-time dashboards to track key performance indicators and adapt strategies as needed.
6. Real-Life Examples of BI Driving E-Commerce Success
Amazon:
- Leverages BI to provide personalized recommendations based on browsing and purchase history.
- Uses predictive analytics to forecast demand and optimize logistics.
Zalando:
- Employs BI tools to reduce return rates by analyzing product feedback and customer behavior.
- Uses sentiment analysis to enhance customer satisfaction.
Shopify Stores:
- Many small businesses use Shopify’s BI tools to identify best-selling products, track abandoned carts, and refine marketing campaigns.
Conclusion
Business Intelligence is no longer optional for e-commerce businesses aiming for growth and success. By leveraging BI to gain actionable insights, e-commerce companies can make data-driven decisions, improve customer satisfaction, and stay ahead of the competition. Whether it’s personalizing the customer experience, optimizing inventory, or fine-tuning marketing strategies, BI is the cornerstone of a successful e-commerce growth strategy.


