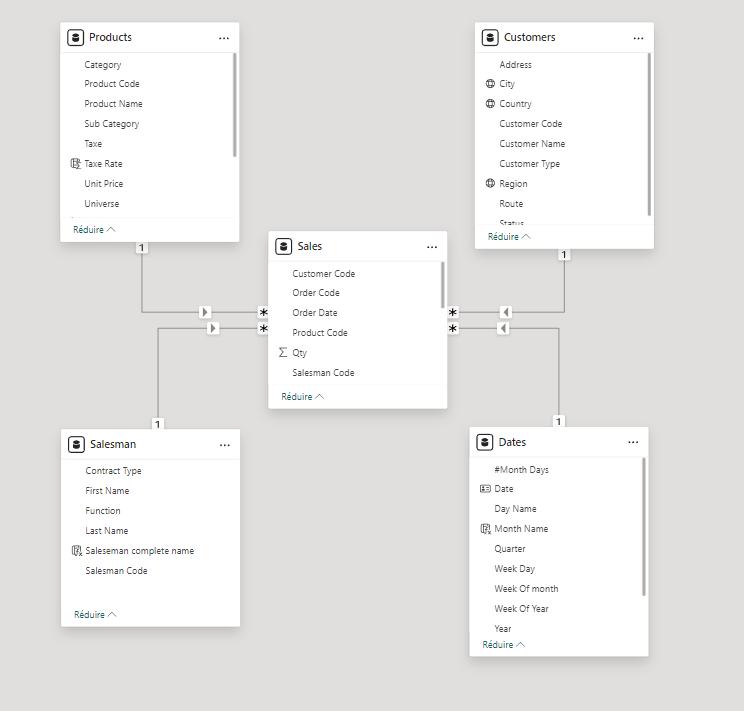
When it comes to Business Intelligence (BI), one of the most critical aspects is ensuring that the data warehouse or reporting system truly reflects the needs of business users. While IT professionals typically build the dimensional model, business users play a vital role in shaping it. Their deep understanding of the business processes and reporting requirements is essential for creating a model that delivers actionable insights.
This article provides a step-by-step guide for business users to effectively translate their needs into a dimensional model.
Understanding the Dimensional Model
A dimensional model is a data structure optimized for querying and reporting, consisting of:
1. Fact Tables: These contain measurable, quantitative data (e.g., sales revenue, order quantity).
2. Dimension Tables: These provide descriptive attributes to contextualize the facts (e.g., customer, product, time).
Business users are key to defining the dimensions and facts because they understand the metrics and attributes required for decision-making.

Steps to Translate Business Needs into a Dimensional Model
1. Identify Business Processes
Start by listing the key business processes that need to be analyzed. Examples might include:
• Sales
• Inventory management
• Customer support
• Financial transactions
For each process, ask:
• What decisions do I need to make?
• What data do I need to support those decisions?
2. Define the Metrics (Facts)
Metrics are the numerical values you want to analyze. Business users should define:
• What needs to be measured (e.g., sales amount, profit margin, order count).
• Granularity of the data: At what level should the facts be recorded? For example:
• Daily sales vs. monthly sales.
• Individual transactions vs. summarized data.
3. Determine the Context (Dimensions)
Dimensions provide the “who,” “what,” “where,” “when,” and “how” for your metrics. Think about the attributes you use to analyze the facts. For example:
• Customer Dimension: Attributes might include customer name, location, age group, or segment.
• Product Dimension: Attributes could include product name, category, price, or brand.
• Time Dimension: Consider the granularity needed—days, weeks, months, or quarters.
4. Create Sample Reports or Dashboards
Before building the dimensional model, create mock reports or dashboards to visualize what you want to achieve. This helps identify:
• Required data fields.
• Filters and drill-downs.
• Relationships between facts and dimensions.
5. Map Requirements to Data Sources
Work with IT or data engineers to ensure the required data exists in the source systems. Business users can provide clarity on:
• The source of truth for each metric.
• How data fields in transactional systems align with business terms.
6. Validate Relationships Between Dimensions and Facts
Business users should confirm:
• The relationships between dimensions (e.g., a product belongs to a category, which belongs to a brand).
• The relationships between dimensions and facts (e.g., sales revenue is tied to a customer, product, and date).
This step ensures the model reflects real-world business processes.
7. Prioritize and Simplify
Focus on the most critical metrics and dimensions first. A common pitfall is trying to include everything at once, which can overcomplicate the model. Start small and expand as needed.
8. Collaborate Continuously
Dimensional modeling is an iterative process. Business users should:
• Regularly review the model as it’s built.
• Provide feedback on test queries and reports.
• Suggest adjustments to better align with business needs.
Example: Translating Sales Reporting Needs
Let’s say a business user wants to analyze sales performance. Here’s how the process might look:
1. Identify Business Process: Sales.
2. Define Metrics:
• Total sales revenue.
• Number of products sold.
• Average order value.
3. Determine Dimensions:
• Customer Dimension: Customer name, location, segment.
• Product Dimension: Product name, category, brand.
• Time Dimension: Day, month, quarter, year.

4. Create Sample Report:
• A report showing total sales revenue by product category and region over time.
5. Map Requirements to Data Sources:
• Verify that the CRM contains customer attributes and the ERP contains product details.
6. Validate Relationships:
• Confirm that sales are linked to both customers and products.
7. Prioritize and Simplify:
• Start with high-level metrics like total sales before diving into detailed analyses like customer lifetime value.
Key Challenges and Solutions
Challenge 1: Misalignment Between Business Needs and Data
• Solution: Use workshops to align on definitions of metrics and attributes.
Challenge 2: Overcomplicating the Model
• Solution: Focus on the “80/20 rule” — prioritize the most impactful 20% of metrics and dimensions.
Challenge 3: Communication Gap with IT
• Solution: Create clear, non-technical documentation (e.g., business requirement documents) to bridge the gap.
Conclusion
Business users play a crucial role in shaping dimensional models by defining the facts and dimensions that reflect real-world business processes. By following the steps outlined above, they can ensure that the resulting model delivers meaningful insights and supports decision-making.
Collaboration with IT and iterative feedback are key to creating a model that evolves with business needs, making the dimensional model not just a technical artifact but a true enabler of business success.
