What is a Fact Table?
A fact table is a fundamental component of a data warehouse, serving as a central repository for quantitative data. It primarily stores measurable, numerical information called facts, which are often derived from business operations and can be analyzed to support decision-making processes. Fact tables contain various metrics that provide insights into the performance of an organization and are typically structured in a manner that allows for analysis against defined dimensions. This design makes the fact table a crucial element of data modeling in various analytical applications.

In contrast to fact tables, dimension tables serve as descriptive attributes related to the facts stored within the fact tables. While fact tables focus on storing quantitative data, such as sales revenue or quantities sold, dimension tables provide context to these numbers through categorical data, such as product details, geographic locations, and time periods. This distinction is critical to understand, as it helps to illustrate how the two types of tables work together to facilitate comprehensive data queries and reporting. In essence, fact tables and dimension tables collaborate to create a robust framework for business intelligence.
Granularity is another key concept when discussing fact tables. It refers to the level of detail represented in the data; for example, a fact table could store daily sales transactions for a store (high granularity) or aggregate sales data on a monthly basis (low granularity).
The choice of granularity influences the capability of the table to support various analytical queries. Additionally, aggregation plays a vital role in fact tables as it involves summarizing data points to provide high-level insights. Together, these attributes ensure that fact tables not only capture essential metrics but also reflect the complexity and dynamism of business processes, making them indispensable in data analytics and reporting.
Characteristics of Fact Tables
The structure of a fact table is typically characterized by its inclusion of measurable data known as “facts” which represent numerical values that are relevant to the business process being analyzed. These measures are often accompanied by foreign keys that reference dimensions from separate tables, creating a relational link between different data points and providing context for the facts.
In essence, every fact table will include fields that are designed to hold these foreign keys alongside various quantitative measures, enabling robust analytical capabilities. The foreign keys relate to dimension tables containing descriptive attributes or characteristics that enrich the raw numerical data. For example, in a sales fact table, foreign keys might link to dimension tables for products, customers, and time, allowing analysts to break down revenue data by product category, customer demographics, or time period.
Another fundamental characteristic of a fact table is the concept of grain, which refers to the level of detail at which the data is recorded. It is vital to determine the appropriate grain to ensure that the fact table captures data at a level that facilitates meaningful analysis. A fact table may represent data at a transactional level, such as each individual sale, or at a higher level, such as daily sales totals. Incorrectly defining the grain can lead to either an overload of unwieldy data or a loss of critical information, both of which hinder analytical performance.
Finally, fact tables are typically designed with a star or snowflake schema, which organizes the data in a manner that optimizes query performance. This structural convention assists in implementing effective data integration processes, ensuring that data can be accessed quickly and analyzed proficiently across different analytical scenarios.
Examples of Fact Tables
Fact tables serve as a crucial component in the realm of data warehousing, providing a structured framework for organizing quantitative data. To better comprehend this concept, we will explore three notable real-world examples: sales fact tables, inventory fact tables, and web analytics fact tables.

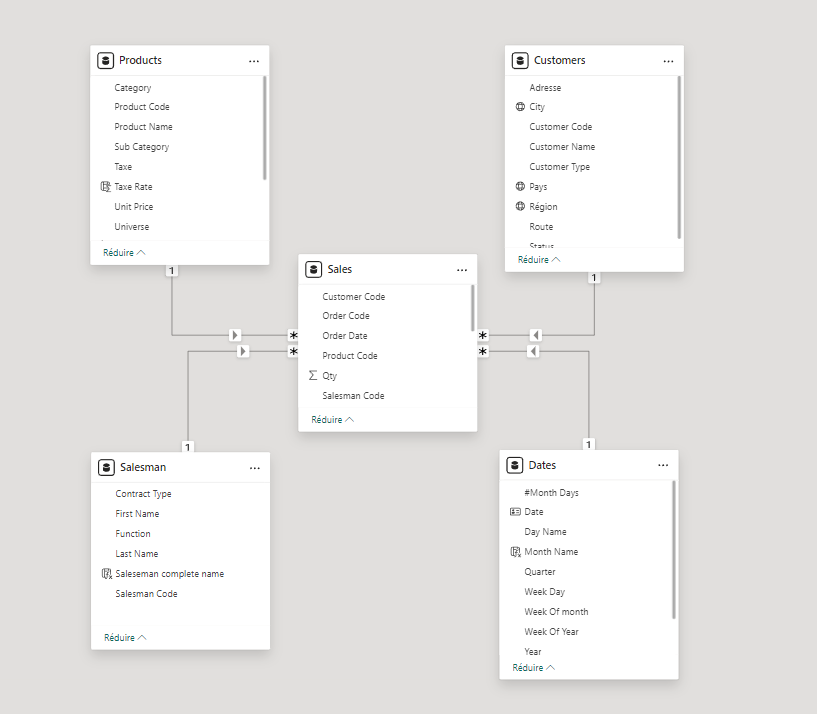
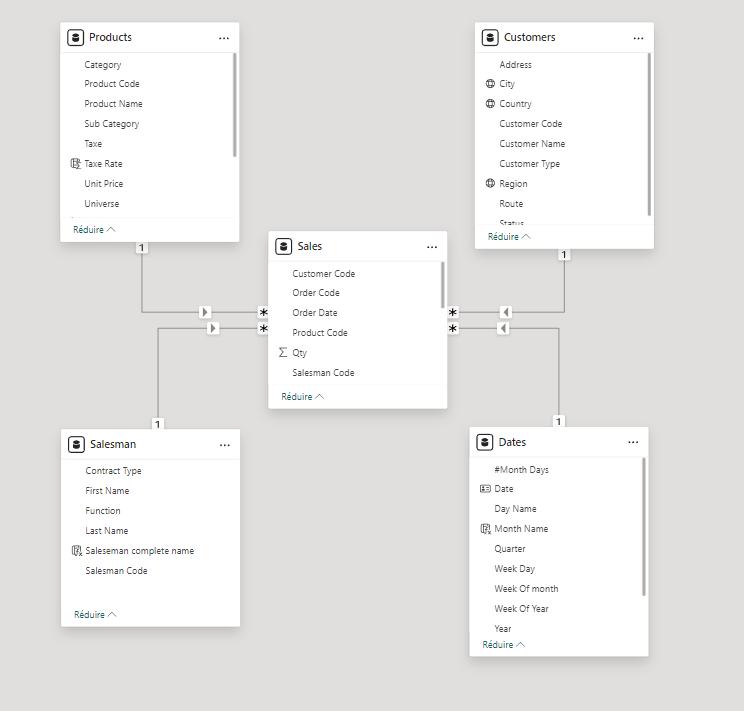
First, consider a sales fact table. This table typically contains measurable data such as Qty, Sales Revenue and discounts. But also columns such as Product Code, Customer Code… to link with dimension tables.
Associated dimensions might include Dates (e.g., Order date), product (e.g., product Code, Category, Unit Price,…), and customer (e.g., customer Code, Customer Name, City, Postal Code…). Analysts can use this structure to perform various analyses, such as determining sales trends over time or comparing the performance of different product categories. For instance, a business could drill down into monthly sales figures to ascertain which products performed best during specific months, thus influencing stocking strategies.
Next, we examine an inventory fact table. This table tracks inventory levels, turnover rates, and replenishment costs. It links to dimensions such as warehouse location, item type, and time. By utilizing this data, managers can assess stock availability and optimize reorder points to prevent stockouts or overstock situations. Analyzing inventory data over periods can reveal seasonal trends, enabling better forecasting and financial planning.
Finally, web analytics fact tables capture user interactions and behaviors on websites. Typical measures within this table may include page views, click-through rates, and session durations. The dimensions could encompass user demographics, browsing device, and traffic source. This setup allows businesses to analyze how different user groups engage with their online platforms, ultimately guiding marketing strategies and website improvements to enhance user experience.
Each of these examples illustrates the versatility and significance of fact tables in enabling organizations to derive actionable insights from their data in various contexts.
Visual Representation and Best Practices
Fact tables serve as the cornerstone of data analytics, providing a structured repository of quantitative data relevant to analysis. A well-designed fact table typically includes metrics that are functionally related and measures that can be aggregated, such as sales revenue or transaction counts. To illustrate this concept, one can visualize a basic fact table encompassing columns such as Date, Product, Store Location, and Sales Amount. Each row represents a transactional event, showcasing how data aligns within the schema.
When designing a fact table, adherence to best practices is critical for ensuring its effectiveness in data analysis. One essential practice is to ensure high-quality data throughout the table. This involves implementing robust validation and cleaning processes to minimize inaccuracies and discrepancies that can hinder analysis outcomes. Additionally, the selection of appropriate grain—defining the level of detail of the data—is crucial. This involves deciding whether the fact table should capture each individual transaction, summarized monthly sales, or aggregated yearly performance.
Another consideration is managing performance issues. Fact tables can grow significantly over time, which may lead to slow query response times. Utilizing indexing strategies can enhance performance, while partitioning large tables into smaller, more manageable sections improves query efficiency and maintenance. Furthermore, maintaining consistency across the data model is vital. This includes standardizing naming conventions, keeping data types consistent, and ensuring that dimensions linked to the fact table are uniformly structured.
To optimize fact tables for better analytical outcomes, consider employing a star schema or snowflake schema in your data warehouse. These models help in organizing data efficiently and enhance the speed of analytical queries. Periodically reviewing and revising the fact table structure based on evolving requirements can also lead to more relevant insights, ensuring that it continues to serve its purpose effectively.
